The EMR Guide · Statistics
Workers’ comp and EMR statistics.
The figures behind a contractor's workers' comp bill and experience mod, each one traced to the public filing, release or dataset it came from.
This page lists 119sourced figures on workers’ comp and the experience modification rate (EMR, also called the X-Mod or e-mod), all published in The Mod Report. Every figure links to its original source and to the report that puts it in context. A figure is listed only when that source link exists. Latest figure added November 18, 2026.
Rates and renewal pricing
Filed and approved loss cost and rate changes, and what renewals are actually pricing at. A label says whether a figure is proposed or approved.
- +5.2%
Construction production-worker hourly pay, October 2026 vs. a year earlier
Source: AGC analysis of BLS data · Reported
- $22B
Projected 10-year Rx savings from DOL PBM rule, health plans only
Source: DOL EBSA · Reported
- $101K
Premium allegedly lost on $968K of concealed payroll, one Florida policy year
Source: Florida DFS · Reported
- +1.6%
Proposed Alabama assigned risk rate change, effective March 1, 2027
Source: NCCI filing summary, Oct. 2026 · Reported
Alabama Assigned Risk Rates Rise 1.6% as the Voluntary Market Falls
- −11.7%
NC contracting loss-cost cut approved for policies effective 4/1/27
Source: NCRB C-26-9 · Reported
- −1.10%
Workers comp renewal rate change, August 2026
Source: Ivans Index, Sept. 2026 · Reported
- −7.4%
Proposed Florida voluntary workers' comp rate change for 2027
Source: Insurance Business · Reported
- 3x
Penalty premium for audit access failure
Source: CA Ins. Code · Reported
- −14.6%
Massachusetts workers' comp statewide rate cut, effective July 2024
Source: Insurance Journal, July 2026 · Reported
- +13%
Construction medical severity, AY2024 vs. AY2023
Source: NCCI 2026 SOL Guide · Reported
- −1.31%
Workers' comp renewal rate change, May 2026
Source: Ivans Index May 2026 · Reported
- $14B
Workers' comp reserve redundancy, year-end 2025
Source: NCCI 2026 SOL Guide · Reported
- 90%
Labor-only subcontract price minimum payroll basis
Source: NCRB Basic Manual · Reported
- −6.9%
Florida voluntary workers' comp rate change, 2026 statewide average
Source: Florida OIR, November 2025 · Reported
- −0.2%
Workers' comp net written premium change, calendar year 2025
Source: NCCI 2026 State of the Line · Reported
- 4x
Medical utilization for WC claims with diabetes comorbidity
Source: NCCI AIS 2026 · Reported
- $3B
California WC reserve cushion, 2024 (collapsed from $17B in 2017)
Source: Risk Placement Services 2026 · Reported
- +10.4%
WCIRB proposed pure premium rate increase, Sept. 2026
Source: WCIRB Filing, May 2026 · Reported
California Workers Comp Rate Hike: What 10.4% Signals for Southeast Construction
- 102%
Accident-year combined ratio, workers' comp, 2025
Source: NCCI AIS 2026, May 2026 · Reported
NCCI Accident-Year Ratio at 102%: What the 91% Headline Hides
- +6.6%
Construction input cost increase, year over year, April 2026
Source: AGC / BLS PPI, May 2026 · Reported
- .001
New minimum ELR increment, NCCI decimal extension, Jan 1, 2026
Source: NCCI Decimal Extension Circular · Reported
- +6%
Annual WC cost growth across 18 states, 2022-2025
Source: WCRI CompScope 2026 · Reported
WC Costs Rising 6% Per Year: What the WCRI 2026 Report Means
State rate actions and rules
State-level filings, statutory figures and fee rules that set what a claim costs in one jurisdiction and not the next.
- $651K
Premiums an unlicensed Florida RRG allegedly collected in two years
Source: Insurance Journal, Oct. 29, 2026 · Reported
- $100K
Standard NC employer's liability limit, each accident
Source: NCRB Basic Manual, Rule 5 · Reported
NC Workers Comp Exclusivity Doesn't Cover a Supervisor's Fists
- 2X
Stop-work penalty multiplier on evaded WC premium under Florida law
Source: Fla. Stat. 440.107 · Reported
- 21.9%
New York loss cost decrease effective October 1, 2026
Source: NY DFS · Reported
- −14.3%
NC residual market decrease proposed for April 1, 2027, vs 10.6% voluntary
Source: NCRB C-26-6 · Reported
- +4.8%
TN loss cost and assigned risk increase, effective Oct 1, 2026
Source: TDCI Order No. 26-54 · Reported
- −7.4%
Florida proposed workers comp decrease, effective January 1, 2027
Source: NCCI FL rate filing · Reported
- $7,600
Florida defense attorney fees per workers comp claim, 2025
Source: WCRI CompScope, 2026 · Reported
- 307
Previously uninsured SC employees covered in June 2026
Source: SCWCC July packet · Reported
- $1.5K
Tennessee temporary weekly max for July 1, 2026 injuries
Source: TN BWC July 2026 · Reported
- $52.00
SC medical conversion factor, held flat for the 2026 fee schedule
Source: SC WCC 2026 Fee Schedule · Reported
South Carolina Fee Schedule Is a Mod Story, Not Just Compliance
- 210%
WC surgical reimbursement, Florida, % of Medicare, 2025
Source: Florida SB 362 (2025) · Reported
- $43M
Projected 5-year WC insurer savings from FL physician-dispensing ruling
Source: Insurance Journal, Feb 2026 · Reported
- $40K
New NC cap on serious disfigurement and organ injuries, effective July 2027
Source: NC SL 2026-14 (HB 315) · Reported
North Carolina Workers' Comp Benefit Increase: Price It for 2027
- +100%
Increase in NC serious disfigurement and organ-injury caps, effective July 2027
Source: NCGA HB 315 / SL 2026-14 · Reported
North Carolina Workers' Comp Benefit Caps Double: Reserve Reviews Before 2027
- −0.4%
SC voluntary loss cost change effective April 1, 2026
Source: NCCI SC filing · Reported
- 3+
Employees triggering Virginia comp coverage on bid
Source: Bristol ITB · Reported
- 15
Fictitious certificate of insurance referrals, Florida FY 2024-25
Source: FL DFS FY24-25 · Reported
- 349K
Construction workers needed in 2026, fueling temp staffing reliance
Source: ABC Workforce Report, 2026 · Reported
Tennessee Exclusive Remedy Has Two Lanes. Which One Protects Your GC?
- $0
Payroll exposure on ghost WC policies generating valid certificates
Source: TN SB 1579, 114th Gen. Assembly · Reported
Zero Exposure Workers Comp: Ghost Policies Inflating GC Mods
- 34%
Hispanic share of U.S. construction workforce, 2023 ACS
Source: CPWR Data Bulletin, Dec 2024 · Reported
NC Workers Comp Fraud Scheme: When Injured Workers Disengage, Your Mod Pays
Experience rating and mod math
The values and trends that feed the experience mod formula itself: split points, frequency, claim cost growth and the payroll base.
- −2.9%
US construction spending, January to September 2026 vs. same period 2025
Source: Census Bureau CB26-176 · Reported
Shrinking Payroll and Your Experience Mod: The Down-Year Trap
- $15.0K
Colorado's proposed 2027 primary/excess split point, up from $14,500
Source: NCCI filing NCCI-135032459 · Reported
- 4–8%
Annual medical payments-per-claim growth in most states, 2022–2025
Source: WCRI CompScope 2026 · Reported
- 0.51
Florida pure loss cost for Code 5606, 2026 filing
Source: FLOIR 2025 · Reported
- −4.1%
Construction frequency average annual change, AY2015-2023p
Source: NCCI Industry Drill Down · Reported
- 21mo
Nearest policy age included in the mod experience period
Source: NCCI E-1411 · Reported
- +21%
Recommended payment per Florida workers' comp medical bill
Source: Enlyte 2026 · Reported
Claim costs and severity
What claims cost once they happen: medical inflation, treatment timing and the rules that decide how a claim is counted.
- $7.8M
PA Walmart child labor settlement that began with comp injury referrals
Source: PA Governor's Office · Reported
- +10.1%
Construction medical payments per lost-time claim after Medicaid loss, 12 months
Source: WCRI (via Business Insurance) · Reported
- $67.7M
Los Angeles silicosis verdict against Caesarstone entities, October 2026
Source: Business Insurance · Reported
- 14.7d
Avg. days to first treatment, 2023, up from 12.8 in 2016
Source: NCCI Medical Treatment Dynamics · Reported
- 7.5%
GA workers' comp premium credit for a certified drug-free workplace
Source: Georgia SBWC · Reported
- 57%
Top claims performers using analytics vs 34% of low performers, 2026
Source: Rising Medical Solutions · Reported
- 24 hr
OSHA report window for work-related amputations
Source: OSHA 1904.39 · Reported
- 1.0%
NCCI Workers' Comp Medical Inflation Index, June 2026
Source: NCCI Medical Inflation Insights · Reported
Medical Inflation Cools to 1.0%, But One Severe Claim Still Drives Your Mod
- 6
Physicians a valid Georgia panel must list under OCGA 34-9-201
Source: OCGA 34-9-201 · Reported
The Georgia Panel of Physicians Mistake That Costs You a Mod
- +41%
Florida workers' comp professional medical prices, 2024 vs 2025
Source: WCRI MPI-WC 2026 · Reported
Florida Medical Severity Mod: Is Your Worksheet Catching It?
- 14.4%
Share of professional payments from unlisted codes, 2024
Source: CWCI 2026 · Reported
- +6%
Medical cost per lost-time claim growth, 2024-2025p
Source: NCCI 2026 SOL Guide · Reported
- 3 yrs
Typical NCCI experience period one claim can affect
Source: NCCI ABCs 2025 · Reported
- 120
Days in Florida's pay-and-investigate window
Source: Fla. Stat. 440.20 · Reported
- 114
Average construction lost workdays per indemnity claim, 2021-2025
Source: Travelers 2026 Report · Reported
- 50%
Approximate claim share from musculoskeletal and soft-tissue injuries
Source: Enlyte 2026 · Reported
- 4x
Medical cost multiplier, lost-time claims with behavioral health treatment
Source: Enlyte 2026 Envision Report · Reported
Behavioral Health Claims Are the Mod Driver Nobody's Measuring
- 41%
FL claimant attorney involvement rate, workers' comp claims
Source: WCRI CompScope 2026 · Reported
Florida Workers Comp Attorney Involvement Hits 41%: What It Costs Your Mod
- 471%
Alabama WC outpatient surgery payments above Medicare, 2024 data
Source: WCRI, May 2026 · Reported
Alabama Workers Comp Surgery Costs: 471% Above Medicare and Rising
- +24%
Quarterly Rx payments per WC medical claim, Q1 2022 to Q1 2025
Source: WCRI Drug Trends, 6th Ed. · Reported
Workers' Comp Pharmacy Costs Are Rising Again, and Your Mod Will Show It
- +4%
Workers' comp medical claim severity growth, 2025
Source: NCCI 2026 SOL Guide · Reported
Workers' Comp Medical Inflation Is Compounding Inside Your Mod
- +5%
Florida workers' comp total cost per claim growth, 2025
Source: WCRI CompScope 21st Edition · Reported
Florida Workers Comp Costs Up 5%: What It Means for Your Experience Mod
- 97
Avg. lost workdays per injury, workers age 60+, 2021 to 2025
Source: Travelers 2026 Injury Impact Report · Reported
Aging Workforce, Rising Mod: What 97-Day Recoveries Cost Contractors
- 7.6M
Fewer obese US adults since 2022, driven by GLP-1 drug adoption
Source: Gallup, 2025 · Reported
The GLP-1 Effect on Workers Comp: Obesity Is Finally Falling
Jobsite hazards
Where construction injuries and citations concentrate, by cause and by cost.
- 4.4%
Share of 2024 construction deaths caused by violent acts, of 1,034 total
Source: BLS CFOI, 2024 · Reported
- 1,863
Lockout/tagout citations, FY2026, OSHA's third most-cited standard
Source: OSHA FY2026 Top 10 · Reported
- 4,041
OSHA fall protection citations, preliminary FY2026, 16th straight year No. 1
Source: OSHA via Safety+Health · Reported
OSHA Top 10 Violations 2026: The Same Five Standards, Your Mod
- 26%
Lower-level falls' share of construction serious-injury direct costs
Source: Liberty Mutual WSI 2026 · Reported
- $165K
Willful or repeat OSHA penalty ceiling after Jan. 15, 2026
Source: OSHA, May 2026 · Reported
- $12.8M
Susan Harwood training grants announced July 1, 2026
Source: OSHA Federal Register, July 2026 · Reported
- 1,034
Construction industry fatalities, calendar year 2024
Source: BLS CFOI, 2024 · Reported
- 7×
Rise in heat-illness claims on days above 90 degrees
Source: WCRI, December 2024 · Reported
- $165K
Maximum OSHA willful or repeat penalty after Jan. 15, 2026
Source: OSHA, May 2026 · Reported
- 7,000
Heat-related OSHA inspections since NEP launch in 2022
Source: OSHA, April 2026 · Reported
Heat Prevention Programs: What the Documentation Gap Costs Your E-Mod
- 80°F
Heat index threshold for OSHA heat priority day inspections
Source: OSHA Heat NEP, April 2026 · Reported
Southeast Heat Season: Why 80°F Drives Your Construction Mod
- 7x
Heat claim increase at 90°F vs. 75-80°F, 2013-2022
Source: WCRI FlashReport, Dec 2024 · Reported
- $3.85
Federal OSHA budget per protected worker, FY 2026
Source: AFL-CIO Death on the Job 2026 · Reported
OSHA's Inspector Shortage Is a Mod Problem, Not Just a Safety One
- $16.5K
Max OSHA penalty per serious HazCom violation, effective 2025
Source: OSHA Federal Register, Jan 2025 · Reported
OSHA HazCom Revision 7: What Contractors Owe by May 19, 2026
- 68.9%
Fatal construction falls occurring at specialty trade contractors, 2022
Source: BLS CFOI, 2022 · Reported
Where Fatal Construction Falls Actually Happen: The Sub Problem
- 55
Industries targeted by OSHA's revised Heat NEP, effective April 2026
Source: OSHA Heat NEP, April 10, 2026 · Reported
- −70%
Size-based penalty discount eliminated in NC fatality cases
Source: NC DOL press release, April 2026 · Reported
Workforce
Who is getting hurt, and how the makeup of a crew changes claim cost.
- +21%
Extra medical care cost on claims involving workers 65 and older
Source: NCCI, October 2026 · Reported
- 44%
Share of construction injuries from first-year employees (Travelers, 2026)
Source: Travelers Injury Impact Report 2026 · Reported
New Hires Are Your Next Mod Problem: Travelers 2026 Injury Data
- 114K
Average monthly job gains, 2026 year to date
Source: NCCI Economy Snapshot · Reported
- 80
Site-prep contractor fatal injuries, 2024
Source: BLS CFOI 2024 · Reported
- 47%
Construction claim costs from first-year employees, 2021-2025
Source: Travelers 2026 Injury Impact Report · Reported
Construction New Hire Mod Risk: Every Crew Expansion Is a Safety Bet
Verdicts, penalties and single cases
One event each: an award, a proposed penalty, a loss one contractor absorbed. Not statistics, but dated, sourced and often the number people are looking for.
- $675K
Retaliatory discharge award affirmed against Envoy Air, Oct. 2026
Source: Alabama Supreme Court · Reported
- 27 mo
Delay before a hidden employer could be added to a VA injury claim
Source: Insurance Journal, Sept. 2026 · Reported
- 6 days
Days after his injury a worker's first Virginia WC filing locked out Tennessee
Source: TN Workers' Comp Court · Reported
- $165K
Proposed willful penalty, T&T Pipeline, New Smyrna Beach fatality
Source: OSHA (U.S. DOL) · Reported
OSHA Willful Violation Penalty Caps at $165,514. Your Mod Doesn't.
- $700K
Added premium one Georgia GC absorbed from a single fake certificate
Source: Insurance Journal · Reported
- $30M
Damages sought in staffing-worker fall suit at xAI Memphis site
Source: Shelby County docket · Reported
- $180K
Claims and defense costs a NC GC absorbed when subs' coverage lapsed
Source: The Contractor Matrix · Reported
- $8.55M
Bennett compensatory verdict plus attorney fees
Source: GA Court of Appeals · Reported
- $100M
Payroll processed through shell construction corporations in Florida AG case
Source: Florida AG, Aug 2025 · Reported
Certificate Rental Fraud: How Subcontractor WC Schemes Hit Your EMR
- 109°
Heat-stroke victim's body temperature on arrival, Moreno v. Florida Orange Gold
Source: Insurance Journal · Reported
Heat Claims Are Still Comp Claims: Southeast Contractors Before the Next 103-Degree Day
- $562K
Unauthorized bills sought in Tennessee Hands appeal, denied under fee schedule
Source: TN Workers' Comp Appeals Board, 2025 · Reported
Unauthorized Medical Bills and Your EMR: The Tennessee Hands Lesson
- $2.77M
STG Logistics misclassification settlement, New Jersey, 2025
Source: NJ Dept of Labor, 2025 · Reported
- $344K
Proposed penalties after Blazey trench collapse, July 2026
Source: OSHA, July 2026 · Reported
- $299K
Proposed OSHA penalties after Converse crawl-space fatality
Source: OSHA 26-1183-DAL · Reported
- $415K
MDA premium allegedly avoided, 2024-2025 policy
Source: Palm Beach Affidavit · Reported
- $973K
Default judgment affirmed in June 2026 fall case
Source: Texas 5th COA · Reported
- 16
Worker's age in Thigpen compactor death
Source: Ga. Ct. App. · Reported
- $250M
SCIS gross written premium in 2025 before ANV acquisition
Source: ANV, June 2026 · Reported
- $6.1M
Hidden payroll at HL Temporary Services, 2016 to 2023
Source: DOJ / IRS Criminal Investigation · Reported
- 150+
Benefit payments in Estes case, each a tolling trigger under new rule
Source: 1st DCA, Estes dissent (2026) · Reported
- $115K
OSHA penalties for trench violations after worker fatality, Huntsville AL
Source: OSHA Birmingham, April 2026 · Reported
Trench Fatality EMR Spike: One Claim, Three Years Uninsurable
- 5
Felony fraud charges, EliteOne Solutions owner, GA
Source: Georgia, April 2026 · Reported
The Dalton Fraud: What Fake WC Certificates Cost the GC Who Hired the Sub
- $148M
Payroll funneled through fake WC certificates in decade-long FL scheme
Source: DOJ, M.D. FL sentencing, May 2026 · Reported
How these figures are chosen
Each figure was published in a dated Mod Report article and is shown here exactly as that article cited it. The source named beside it is the organization that produced the number, such as NCCI, a state rating bureau, a state insurance department, OSHA, the Bureau of Labor Statistics or WCRI, and the link goes to that source’s own page or document.
The date is the day the report ran, not the period the figure measures. The period is in the description. Rate and loss cost figures say whether they were proposed or approved when the report ran; a proposed figure can change before it takes effect, so check the linked source for its current status.
To cite a figure, cite the original source and its date. If the context helped, link the report as well. Statistics describe a market. Your own premium is set by your payroll, your classifications and your experience mod, and how that mod is calculated is its own subject.
Averages describe the market. Your worksheet describes you.
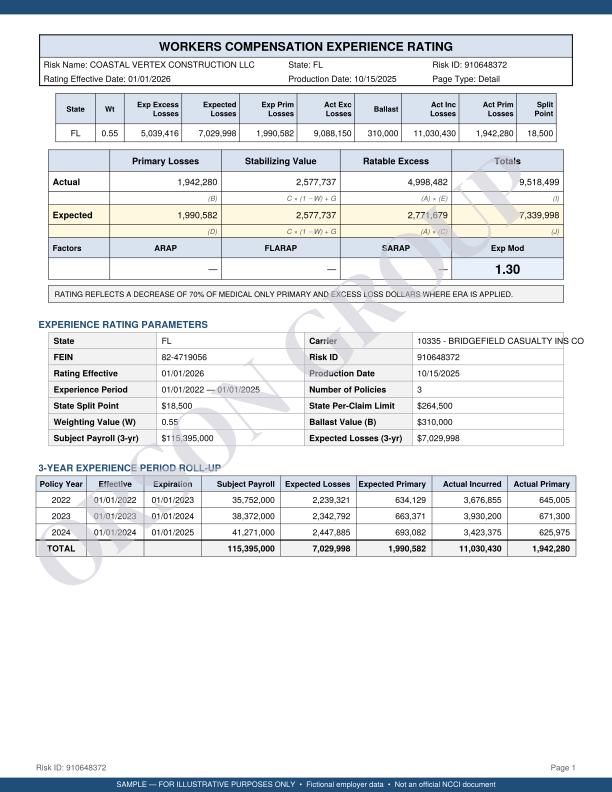
Upload your NCCI experience rating worksheet. We'll review it at no cost. If we find errors, you only pay when we recover your money.